
Operational Telemetry Data Governance for EdTech A Practical Guide to Trustworthy Metrics
- Published on: September 10, 2026
- Updated on: September 25, 2026
- Reading Time: 7 mins
-
Views
Why Usage Data Governance Is a Real Problem for EdTech and Publishing
Why It’s Not Just a Reporting Inconvenience
This Isn’t an Integration Problem
What Typically Causes Usage Data Reporting Problems
Cause 1: Inconsistent Instrumentation Inside the Product
Cause 2: Gaps Further Downstream in the Data Platform
The Repercussions of Bad Usage Data Across Business, Product, and Teams
How to Solve This: Building a Usage Intelligence Assessment
Fixing the Application Layer
Fixing the Data Platform Layer
Where to Start: A Practical, Priority-Based Implementation Plan
FAQs
Most edtech companies and publishers collect usage data across more products, platforms, and analytics systems than they can confidently account for, and that gap is expensive.
I was on a call a few months ago where a CEO of a company complained that his customer success lead and head of product each described the same account differently, using numbers pulled from the same underlying platform. He said that he didn’t trust any of the numbers presented.
Nobody made a mistake. They were just looking at data that had drifted apart somewhere between the product and the report. This piece breaks down why that happens, what it costs, and what a practical fix looks like, drawn from the data projects I’ve worked on directly with edtech and publishing clients.
Why Usage Data Governance Has Become a Real Problem for EdTech and Publishing
A learner or customer interaction today rarely happens in just one place, and that’s the root of the whole problem. It might occur inside:
- Your main platform
- An embedded LTI experience
- An iframe
- A media player
- A search tool
- Multiple connected third-party products ( CRM, Admin, and so on)
From there, that single interaction has to pass through analytics tools, data pipelines, transformation logic, account tables, and reporting systems before it becomes a number someone can actually act on.
Each step is another place where data can get lost, duplicated, stripped of context, or linked to the wrong customer or product entirely.
I’ve watched this ecosystem grow more tangled every year, and the scale is real.
Why It’s Not Just a Reporting Inconvenience
EdTech companies use this data for decisions that carry real commercial weight.
In one recent engagement, I saw usage data feed customer renewal conversations, royalty-bearing events, revenue reporting, and product roadmap decisions, all pulled from the same underlying numbers.
When those numbers are wrong, low confidence in the data stops being a reporting inconvenience. It becomes a business risk.
This Isn’t an Integration Problem
I also want to be clear: this isn’t really an integration problem, even though it often gets treated like one. Companies connect the LMS to the CRM, pipe assessment data into a warehouse, ship a dashboard, and assume that the hard part is done.
In my experience, you can wire every system together perfectly and still end up with different answers to the same question because no one agrees on what the data should mean before it starts flowing.
Most companies already have plenty of analytics infrastructure. But they’re missing a governed framework that can actually prove those numbers represent real customer behavior.
What Typically Causes Usage Data Reporting Problems
In the projects I’ve worked on, unreliable usage data almost always traces back to two distinct failure points: one inside the product itself, and one further downstream in the data platform.
Cause 1: Inconsistent Instrumentation Inside the Product
The first cause sits inside the product itself. On one recent project, my team found several user interactions that weren’t sending analytics events anywhere at all, gaps across embedded articles, audio, video, search, and navigation, and other everyday product workflows that everyone assumed were already being tracked.
Where events did fire, they weren’t always reliable either. Some fired more than once for a single action. Others lacked content or product identifiers, carried weak identity information, or attributed activity to the wrong context entirely.
This won’t show up as an obvious outage. It will slowly erode trust in every number built on top of it, and by the time someone notices, months of reporting are already in question.
Cause 2: Gaps Further Downstream in the Data Platform
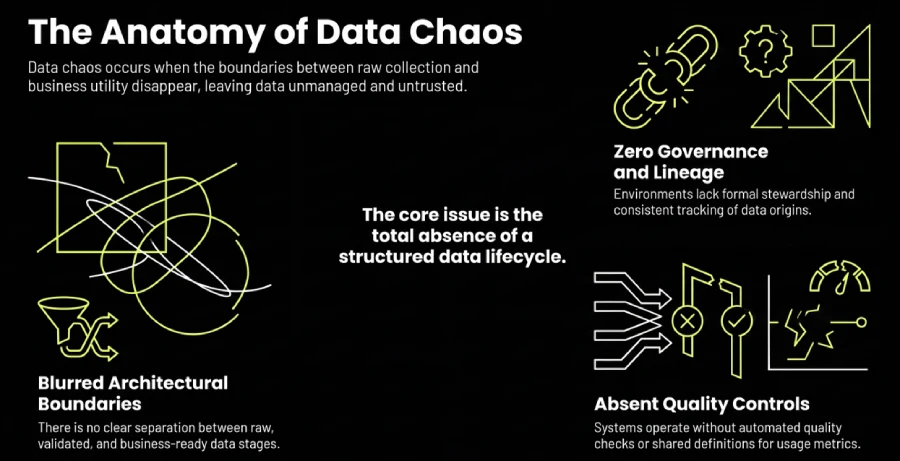
The second cause sits further along the pipeline, inside the warehouse itself. In many of the environments I’ve reviewed, there’s no clear separation between:
- Raw data
- Validated data
- Business-ready data
While also having:
- No consistent lineage,
- No formal stewardship,
- No automated quality checks, and
- No shared definitions for important usage metrics.
A metric like “active user” can end up meaning something slightly different depending on which table you happen to pull it from, and it’s impossible to notice until two reports disagree.
I’ll give you a real example. A historical GA4 dataset had stopped refreshing for over a month before anyone realized, while a separate reporting pipeline had failed five consecutive times in the background. On top of that:
- Manual ingestion steps introduced their own errors
- ProductID mappings were missing in places
- Tables overlapped without anyone realizing it
- Migration records were incomplete
This isn’t unique to any one company either. A June 2026 GAO report on federal award data found the same pattern at a much larger scale: missing values, duplicate records, and no governance body in place to keep data consistent across systems.
The lesson holds either way: these problems compound. Applying a simple correction factor to a final report won’t fix something that’s broken at different points upstream.
The Repercussions of Bad Operational Telemetry Data
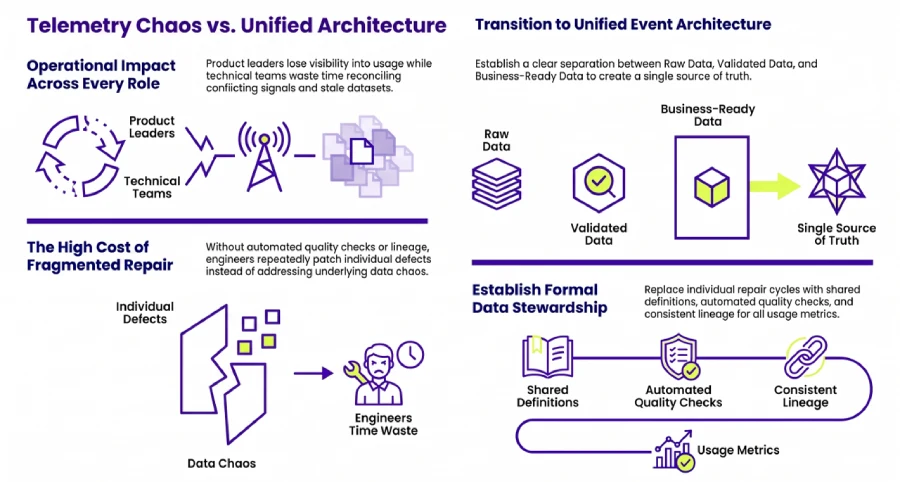
Unreliable usage data doesn’t stay contained to one team. It shows up differently depending on where you sit, but everyone ends up paying for it.
Customer success teams may enter renewal conversations with an incomplete account view. Finance and royalty teams may work with undercounted or overcounted events. Executives may see declining usage without knowing whether it reflects genuine customer behavior, migration effects, attribution problems, or a failed pipeline.
Product and technical teams experience the problem differently. Product leaders cannot clearly see which features, content types, or workflows customers use.
Engineers repeatedly repair individual tracking defects without addressing the underlying event architecture.
Data engineers investigate failed jobs and stale datasets, while analysts spend time reconciling conflicting numbers instead of analyzing behavior.
Unreliable signals can hide whether search, media, embedded content, and other learning experiences are working as intended, weakening the product team’s ability to prioritize improvements.
How to Solve This: Building a Usage Intelligence Assessment
The best starting point I’ve found is an end-to-end usage intelligence assessment, not a quick audit of the dashboard everyone already distrusts.
1. Start with the business questions the data needs to answer.
2. Now build a complete inventory of the interactions that matter.
3. Combine static code analysis with live product testing and inspection of real analytics traffic, rather than trusting documentation that hasn’t been checked against what the product is actually doing.
4. From there, trace each event from the original user action all the way through the analytics platforms, pipelines, transformations, and final report.
Where multiple analytics sources exist, reconcile them against each other instead of assuming one of them is automatically correct just because it’s the one everyone’s used to looking at.
The longer-term fix runs on two tracks at once:
- The application layer, where the data originates.
- The data platform layer, where it gets assembled into something people can actually trust.
Fixing the Application Layer
At the application level, this comes down to a handful of specific fixes:
- A shared event contract across the product
- Consistent content and product identifiers
- A stable identity model
- Tracking that actually covers embedded experiences
- Exact-match deduplication
- Backup server-side events for anything financially important
Each of these closes a specific gap I described above, and skipping any one of them tends to reopen it later.
Fixing the Data Platform Layer
At the data platform level, I favor a Bronze, Silver, and Gold architecture that clearly separates raw data from validated data and governed business metrics. On top of that architecture, you need:
- Scheduled quality checks and pipeline alerts
- Retry logic for failed jobs
- Lineage and metadata logging
- Named stewardship for each data domain
- Agreed metric definitions everyone actually uses
The Federal Data Strategy makes a similar point in a very different context: it names accountability and stewardship as core principles for treating data as a trustworthy asset. That’s the same discipline I’m describing here, just applied to usage data instead of federal records.
I’ve seen this play out with a client too, where the right fix wasn’t a new platform; it was fixing the governance around the Databricks environment they’d already invested in. That won’t always be the right call for every organization, but it’s worth checking before you assume you need to start over from scratch.
Where to Start: A Practical, Priority-Based Implementation Plan
You shouldn’t start by doing everything at once. A better approach is to first define the handful of business metrics that actually matter:
- Records accessed
- Searches
- Page views
- Active user actions per session
- Referral and discovery paths
Then fix the instrumentation gaps that materially affect adoption, conversion, customer reporting, or revenue. There’s little value in tracking every possible click simply because it’s technically possible to.
In parallel, put the architectural controls in place that stop the same problems from coming back. Just fixing the priority events almost always delivers an immediate, visible improvement on its own. But a shared event model, governed data layers, automated monitoring, and clear ownership turn that one-time fix into a capability you can rely on going forward, rather than a problem you’ll be solving again in eighteen months.
That’s really the whole shift I’d ask you to make:
“Stop treating usage data governance as a cleanup project you run once, and start treating it as infrastructure you maintain.”
The companies I’ve worked with that get this right don’t necessarily have perfect data. They have data they can actually trust enough to act on, and in EdTech and publishing, that’s the only bar that actually matters.
I’ll leave you with the same test I use with my own team before we sign off on any usage number: could you defend this figure in a renewal call, in front of the customer whose data it describes, without a caveat attached to it?
- If the answer is yes, you’ve probably got the governance right.
- If it’s no, you now know exactly where to start looking.
If you’re trying to figure out where your own usage data stands, then check out EdDataHub, our data foundation for edtech and publishing companies serving learners, educators, and institutions. We at Magic EdTech would be happy to walk you through what it looks like.

Harish is a future-focused product and technology leader with 25+ years of experience building intelligent systems that align innovation with business strategy. He drives large-scale transformation with cloud, data, and AI, leading agentic AI frameworks, scalable SaaS platforms, and outcome-driven product portfolios across global markets.
FAQs
Check whether the reports use the same metric definition, identity rules, account mappings, and reporting period. Trace the disputed number back to the underlying events and compare the transformations rather than choosing the dashboard that looks most familiar. Aim to explain the difference, not simply force the totals to match.
Define what counts as one interaction before setting the matching rules. Test a single action that produces duplicate records alongside genuine repeated actions, and require the first to count once while the latter remain distinct. Apply the same checks when adding backup server-side events so additional tracking doesn't undermine the metric it is meant to protect.
Determine if your existing environment is capable of handling separate layers for data, quality, lineage, common definitions, and stewardship by name. If not, then resolve this deficiency first rather than assuming the new platform will be the answer. Only after identifying the need should you consider replacement.
Identify which reporting periods, accounts, and decisions were affected before changing historical figures. Recalculate only where the available underlying data supports it, and distinguish corrected numbers from figures that remain uncertain. Prioritize customer-facing and revenue-related reports, and explain the limitations rather than treating an adjusted estimate as an observed count.
Name one accountable steward for the metric and have the teams using it agree on its definition and intended use. Assign clear responsibility for event collection, pipeline reliability, and final reporting so a disputed number has a defined investigation path. Shared use should not mean that every team can redefine the metric independently.
Bring in support when the assessment requires product instrumentation and data-platform work that your team cannot investigate together. When scoping Magic EdTech's EdDataHub support, tie the engagement to the specific assessment and implementation gaps rather than assuming you need a new platform. Keep approval of metric definitions and ongoing ownership with your internal teams.

Get In Touch
Reach out to our team with your question and our representatives will get back to you within 24 working hours.