
Why IPEDS Still Breaks Data Teams, and What to Fix First
- Published on: May 7, 2026
- Updated on: May 15, 2026
- Reading Time: 8 mins
-
Views
Why IPEDS Remain Difficult for Mature Institutions
The Cross-Office Dependencies Behind Errors
Where Does the Reporting Break?
1. How Definitions Change What Gets Counted
2. Why Timing Creates Differences When Data Is Correct
3. Why Graduation Rates Don’t Reflect All Completions
Where the Process Slows Down
Why Manual Work Doesn’t Carry Forward
What to Fix First: A 90-Day IPEDS Stabilization Plan
Days 0–30: Establish Definition Ownership
Days 30–60: Align Source Systems
Days 60–90: Build a Pre-Submission Validation Layer
From Annual Firefighting to a Repeatable Reporting Model
Why IPEDS Matters Even Beyond Compliance
Enabling This Shift: A Unified Data Foundation
Fix the System, Not the Submission
FAQs
Each year, as reporting cycles begin to take shape, data starts moving across campus in a familiar way. Enrollment records are pulled from student systems. Financial data is prepared from ERP platforms. Workforce details are compiled from HR systems. What begins as routine coordination gradually becomes more involved as these datasets are brought together.
Across institutions, the pattern is consistent. Different teams contribute essential inputs, but those inputs are not always created under the same conditions. When they are brought together for IPEDS reporting, small differences in how data is captured or interpreted begin to surface. Inconsistencies tend to appear late in the process.
By then, most of the work has already gone into getting the data ready. The attention shifts to understanding why the pieces don’t line up the way they should. The complexity sits inside the system that produces the data, and becomes visible through the Integrated Postsecondary Education Data System (IPEDS).
Why IPEDS Remain Difficult Even for Mature Institutions
Well-established institutions rarely struggle because of missing tools or inexperienced teams. The difficulty tends to emerge when data moves across functions.
Each office works within its own operational context. Data is created, updated, and stored based on local needs, not always with downstream reporting in mind. When institutional research data is brought together, these differences become visible.
Maturity at the system level does not automatically translate into alignment at the institutional level. Having mature systems in place does not always mean teams are working from the same structure. The connection points between them are often left open.
When there isn’t a shared way to define, time, or prepare data, coordination usually ends up being handled manually. There’s been a gradual shift in how institutions are approaching this. The focus is moving away from just collecting data toward making sure it can actually be brought together and used consistently across teams.
The Cross-Office Dependencies Behind Errors
IPEDS is structured as a set of interrelated survey components, each pulling from different parts of the institution. What gets reported in one area often feeds into another. That connection is where things start to get complicated.
Take a simple situation. An institutional research team prepares enrollment data using a defined reporting cutoff. At the same time, another team is working on completions using student records that continue to be updated as the term closes. Both teams are working correctly within their own timelines.
The issue shows up later. When the data is reviewed together, the counts don’t align the way they are expected to. Not because the data is wrong, but because it was prepared at different points in time and under slightly different assumptions.
In some cases, teams then have to go back and rework parts of the submission. If definitions or formats shift during the process, that effort increases further, and previously completed sections may need to be updated again.
Over time, this is where reporting begins to slow down. The effort moves away from validating results and toward understanding how each piece was produced.
Where Reporting Breaks: Definitions, Timing, and Measurement Boundaries
Not all reporting issues come from incorrect data. Many begin earlier, in how data is defined, when it is captured, and what is included in each measure. These differences are not always visible when teams work within their own processes. They tend to surface only when the data is brought together for reporting.
1. How Definitions Change What Gets Counted
In IPEDS, student data is grouped using specific classification rules. These determine how students are counted across different parts of reporting.
A more practical situation looks like this: A student enrolls in a short-term certificate program and completes it successfully. One team includes that student when reporting completions because the program was finished. Another team excludes the same student from certain counts because the program type or enrollment status does not meet the criteria being used for that report.
Both teams are working with the same student record. The difference comes from how the reporting rules are applied.
2. Why Timing Creates Differences Even When Data Is Correct
IPEDS reporting is built around specific collection points across the year, not a single, continuously updated dataset.
A practical situation looks like this: Enrollment data is captured in the fall and shared for reporting. A few months later, updates happen: students withdraw, change programs, or adjust their enrollment status. These changes are reflected in the system. Now, when another team prepares related data later in the cycle, they may pull the updated version. The earlier enrollment snapshot, however, remains unchanged because it was already finalized for reporting.
When both are brought together, the numbers don’t align. One reflects the earlier snapshot. The other reflects the updated state. Nothing is incorrect. The difference comes from when each dataset was captured and locked.
3. Why Graduation Rates Don’t Reflect All Completions
Graduation rate reporting is based on a specific group of students. It focuses on those who entered as
first-time, full-time, degree- or certificate-seeking undergraduates.
A more practical situation looks like this: A team pulls a list of all students who completed a program in a given year. The total looks higher than expected, so they cross-check it against the reported graduation rate. That’s when the difference shows up. Some of the students in the completion list started part-time. Others transferred in. A few returned after a gap. All of them completed their programs, so they appear in completion counts. But they were never part of the original cohort used for graduation rate reporting.
So the two numbers don’t match. Not because the data is wrong, but because they are based on different groups of students.
When these differences are not clearly defined and aligned, they tend to surface late in the reporting process. What appears to be a mismatch in data often comes down to how that data was grouped, when it was captured, or what was included in the calculation.
This is where higher ed data governance becomes practical. It helps establish shared definitions, align timing, and clarify what each measure is meant to represent.
Where the Process Slows Down
At this point, the issue is no longer about identifying mismatches. It is about how much effort it takes to resolve them. Teams start retracing steps. Which version was used? When was it pulled? What changed since then? The answers are not always easy to find, especially when parts of the process live in separate workflows.
That is where time goes. Across cycles, institutions are starting to focus more on making these steps visible and consistent, rather than resolving them again each time.
Why Manual Work Doesn’t Carry Forward
Most of the effort during reporting happens outside the system. Adjustments are made, numbers are aligned, and issues are resolved. But the steps taken to get there are not always captured in a way that can be reused.
So when the next cycle begins, the same questions come back. An accreditation reporting dashboard can show the final output, but it does not explain how those numbers were arrived at. When something changes, teams still have to work through the same steps again.
There has been a growing focus on making these workflows more traceable, with clearer ownership, defined roles, and shared standards across teams.
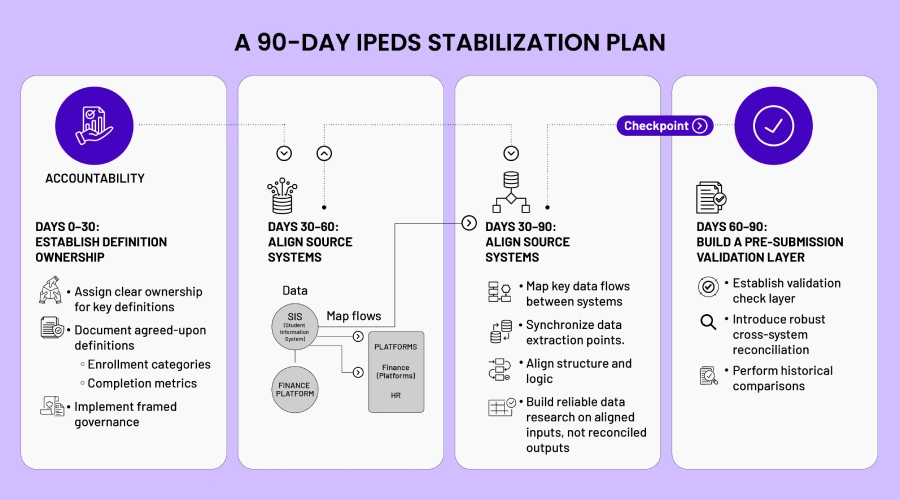
What to Fix First: A 90-Day IPEDS Stabilization Plan
By this point, the pattern is clear. The issue is not in the final report, but in how data is defined, prepared, and carried through the cycle. Trying to fix everything at once usually doesn’t work. Progress tends to come from focusing on a few areas in sequence, starting with how data is understood, then how it moves, and finally how it is checked.
Days 0–30: Establish Definition Ownership
The first step is to assign clear ownership for key definitions across departments. Enrollment categories, completion metrics, and workforce classifications must be agreed upon and documented.
This is where higher ed data governance moves from theory to practice. Governance is not just about policies; it is about accountability. Institutions that invest in governance frameworks, defined roles, and structured planning are better equipped to manage data effectively.
Days 30–60: Align Source Systems
Once definitions are aligned, attention shifts to systems. Data flows between SIS, finance, and HR platforms must be mapped and standardized. This includes:
- Synchronizing data extraction points
- Aligning transformation logic
- Ensuring consistent data structures
At this stage, institutional research data becomes more reliable because it is built on aligned inputs rather than reconciled outputs.
Days 60–90: Build a Pre-Submission Validation Layer
The final step is to introduce a validation layer before reporting deadlines. This includes:
- Cross-system reconciliation checks
- Historical comparisons
- Automated validation rules where possible
Instead of identifying issues during submission, institutions begin catching them earlier in the process. This transforms IPEDS reporting from a reactive effort into a controlled workflow.
By the end of this cycle, the change is not in how fast reports are submitted, but in how much rework is avoided along the way. The process becomes easier to follow, and the same questions don’t return in every cycle.
From Annual Firefighting to a Repeatable Reporting Model
The shift is not about speeding up submissions. It is about changing how reporting is structured.
|
Current Model |
Improved Model |
| Manual reconciliation | Automated validation |
| Rebuilt each cycle | Persistent data pipelines |
| Individual dependency | System-driven workflows |
In this improved state, an accreditation reporting dashboard becomes meaningful. It reflects consistent, validated data rather than stitched-together outputs.
Why IPEDS Matters Even Beyond Compliance
IPEDS is often treated as a compliance requirement. In reality, it reflects how well an institution understands its own data. When institutional research data is consistent and reliable, it supports:
- Enrollment planning
- Financial forecasting
- Workforce strategy
Leaders depend on integrated data, governance, and analytics to make informed decisions. Reporting becomes one outcome of a broader data capability, not the primary goal.
Enabling This Shift: A Unified Data Foundation
Fixing IPEDS challenges requires more than process adjustments. It requires a foundation where data is integrated, governed, and validated consistently. Solutions such as those offered through Magic EdTech’s university data initiatives focus on:
- Bringing together fragmented systems
- Establishing governance frameworks
- Creating repeatable validation layers
This approach is reflected in large-scale institutional efforts like building AI-ready data environments and coordinating complex academic workflows across teams. These are not isolated improvements. They represent a shift toward operating models that reduce fragmentation.
At that point, higher ed data governance and IPEDS reporting stop being recurring pain points and become part of a stable, repeatable system.
Fix the System, Not the Submission
IPEDS does not fail because institutions lack effort or expertise. It fails because the systems behind it are not designed for coordination. Addressing this requires focus in three areas:
- Definition ownership
- System alignment
- Validation before reporting
When these are in place, IPEDS reporting becomes more predictable. More importantly, the data behind it becomes something institutions can trust. And that changes far more than a submission cycle.

Harish is a future-focused product and technology leader with 25+ years of experience building intelligent systems that align innovation with business strategy. He drives large-scale transformation with cloud, data, and AI, leading agentic AI frameworks, scalable SaaS platforms, and outcome-driven product portfolios across global markets.
FAQs
Because the major effort goes into aligning how the data was prepared across teams. The numbers are not always available in a form that can be used together without additional work.
It usually shows up during reporting, but the root cause sits earlier. Definitions, timing, and how data is prepared tend to have a bigger impact than the reporting step itself.
Mostly, the values remain the same, but the version or category changes. While one report utilizes the latest values, some may use older data. Even slight discrepancies can cause huge differences.
Start with definitions. When teams agree on how key measures are defined and applied, much of the confusion later in the cycle can be avoided.

Get In Touch
Reach out to our team with your question and our representatives will get back to you within 24 working hours.